Useful Links
U.S. Citizenship and Immigration Services (USCIS) Website
Social Media
Statistics
Annual Caps for H-1B for Fiscal Years: 85,000 visas
- 65,000 visas
- 20,000 visas for the master’s cap*
The master’s cap – individuals with advanced degrees from U.S. institutions.
Topics
FY 2013-Now: H-1B Petitions Filed & Approved
Tracking H-1B Visa Petitions and Approvals from FY 2013 to Present - Insights, Trends, and Yearly Data.

Each fiscal year, the U.S. Department of Homeland Security (DHS) submits an annual report on H-1B petitions to Congress on behalf of U.S. Citizenship and Immigration Services (USCIS). Recent H-1B fee proposals and court rulings could affect future filing behavior, but neither the earlier $100,000 proclamation payment nor DHS’s proposed $103,265 cap-subject H-1B fee is currently being collected. We compiled thirteen years of filing and approval data to highlight the main trends.
FY 2025 stands out as a split-year: filings rose to 456,725 (+6.9% YoY), while approvals fell to 328,185 (-17.8% YoY). That pushed the raw approval-to-filing ratio down to 71.9%, the sharpest drop in this series.
H-1B Petitions Filed & Approved: FY 2013 - 2025
| Fiscal Year | Petitions Approved | Petitions Filed |
|---|---|---|
| 2025 | 328,185 | 456,725 |
| 2024 | 399,402 | 427,091 |
| 2023 | 386,340 | 386,584 |
| 2022 | 442,043 | 474,301 |
| 2021 | 407,071 | 398,269 |
| 2020 | 426,710 | 427,245 |
| 2019 | 389,378 | 420,577 |
| 2018 | 334,961 | 418,607 |
| 2017 | 373,392 | 403,157 |
| 2016 | 357,211 | 398,803 |
| 2015 | 275,317 | 348,669 |
| 2014 | 315,857 | 318,824 |
| 2013 | 286,773 | 299,467 |
These figures represent all approved H-1B petitions during the respective fiscal years, with only H-1B petitions filed within a given fiscal year included in the count of petitions filed.
Key Insights
01. Sustained Growth Since 2013:
Filings rose from about 299K (FY 2013) to 457K (FY 2025) - an increase of 52%.
Approvals climbed from 287K to 328K (+14%).
➡️ Employer demand for high-skilled foreign talent - especially in STEM fields (science, technology, engineering, mathematics) - remains strong despite occasional policy tightening.
02. Stable Through FY 2024, Then a FY 2025 Drop:
After fluctuating in earlier years (79% in 2018; 91% in 2020), the approval-to-filing ratio stayed mostly in the 93-95% range through FY 2024, then dropped to 71.9% in FY 2025.
➡️ Likely due to streamlined administration and clearer documentation standards post-pandemic.
03. Peak in 2022, Slight Decline Thereafter:
Filings reached a record ≈474K in FY 2022, then eased to ≈427K in FY 2024.
Approvals dropped from ≈442K to ≈399K.
➡️ Reflecting a mix of tech-sector slowdown (2023–2024 layoffs) and tighter caps following the record 2022 cycle.
04. FY 2025 Break in the Trend:
Filings increased from 427,091 (FY 2024) to 456,725 (FY 2025), the second-highest filing year after FY 2022.
Approvals dropped from 399,402 to 328,185, the lowest level since FY 2015.
The filing-approval gap widened to 128,540, the largest gap in this table.
➡️ FY 2025 shows demand staying high while approvals moved in the opposite direction.
Curious Patterns
There are a few “funny” or curious patterns hiding in those numbers once you look closely:
1. The “filed” and “approved” numbers are almost identical in several years.
- Example: 2020 had 427,245 filed vs. 426,710 approved - a difference of only 0.1%.
- That’s statistically improbable given the lottery cap and denials; it suggests these figures are rounded or compiled from different reporting windows.
- 🟡 In other words: it looks like “filed” ≈ “approved,” which shouldn’t normally happen in a capped visa category.
2. Some years seem reversed in logic - more approvals than filings.
2021: 407,071 approved vs. 398,269 filed → approval rate >100%!
Clearly impossible in real life; probably due to petitions “filed” in one fiscal year but approved in the next.
🟡 It’s a reminder that USCIS counts by fiscal-year decision date, not by the filing date - mixing cohorts makes the numbers look weird.
3. Sudden jumps and dips imply reporting or policy quirks rather than demand.
FY 2018 → 2019: approvals rose by 16% despite no major quota change.
FY 2022 → 2023: filings dropped by ~88,000, but approvals barely changed.
🟡 Suggests either backlog clearance, adjudication timing, or data reporting adjustments, not actual demand swings.
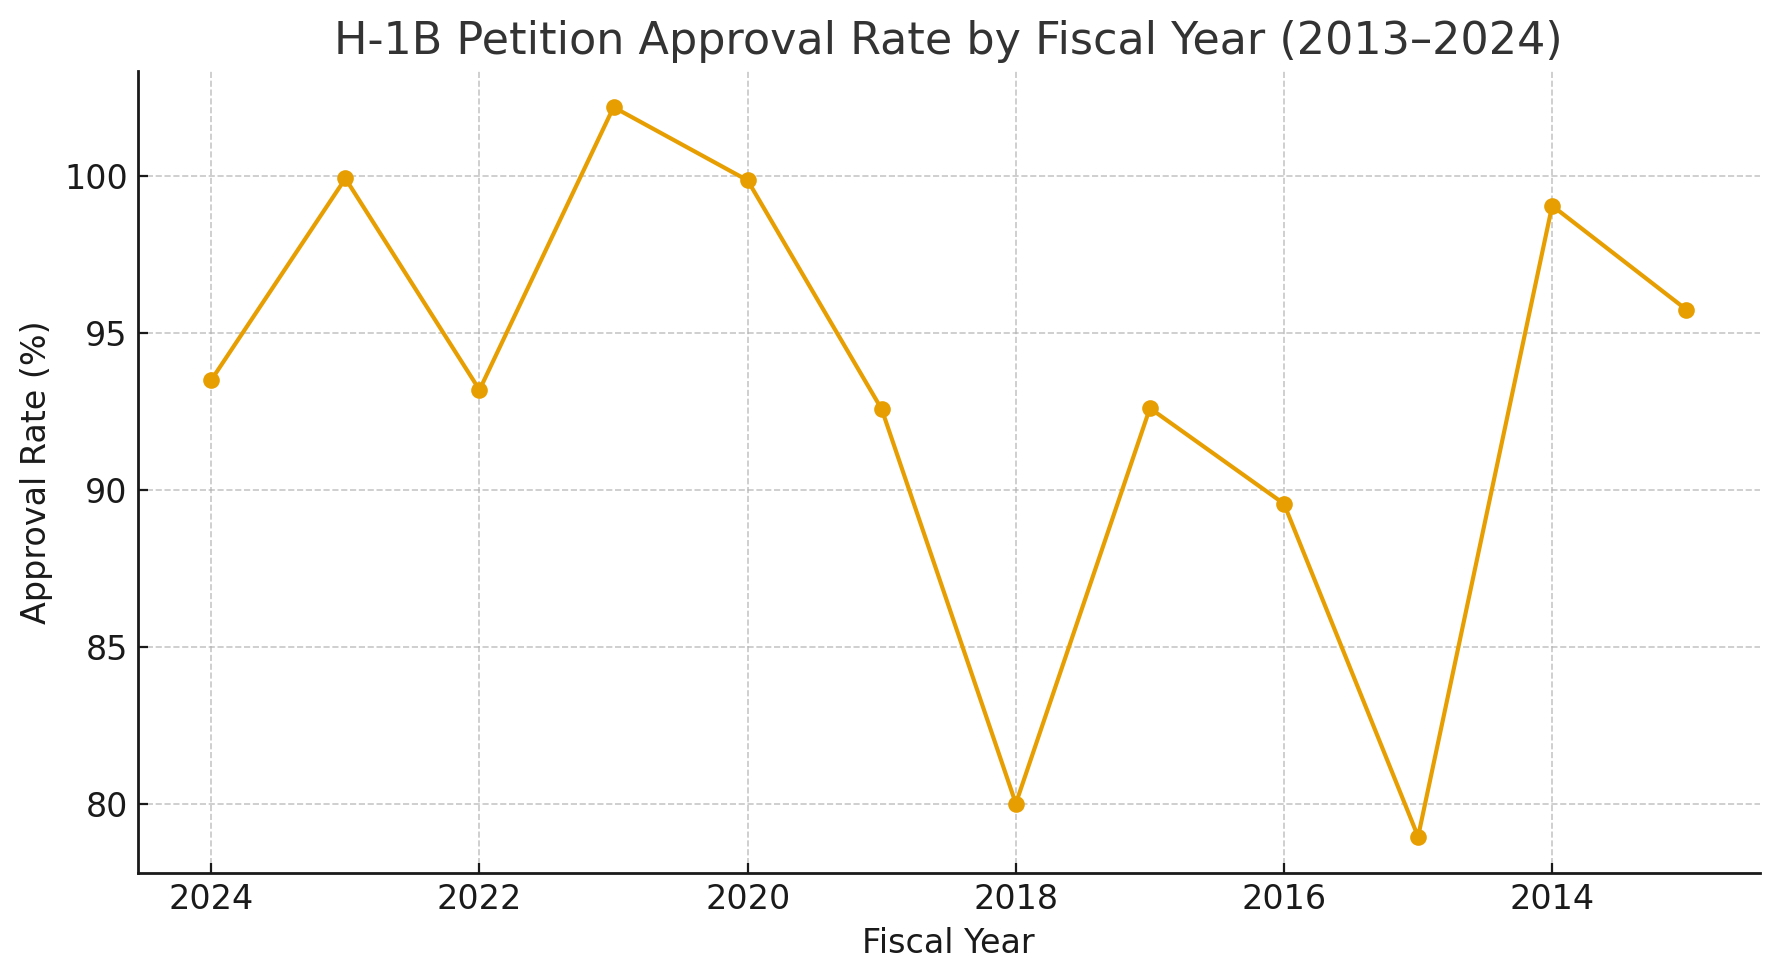
H-1B Petition Approval Rate by FY 2013 - FY 2024
Here’s the chart showing H-1B petition approval rates FY (2013-2024). You can clearly see the dip in approvals around 2018, followed by a steady recovery to above 90% since 2021 - supporting the conclusion that approval consistency and policy stability have improved in recent years.
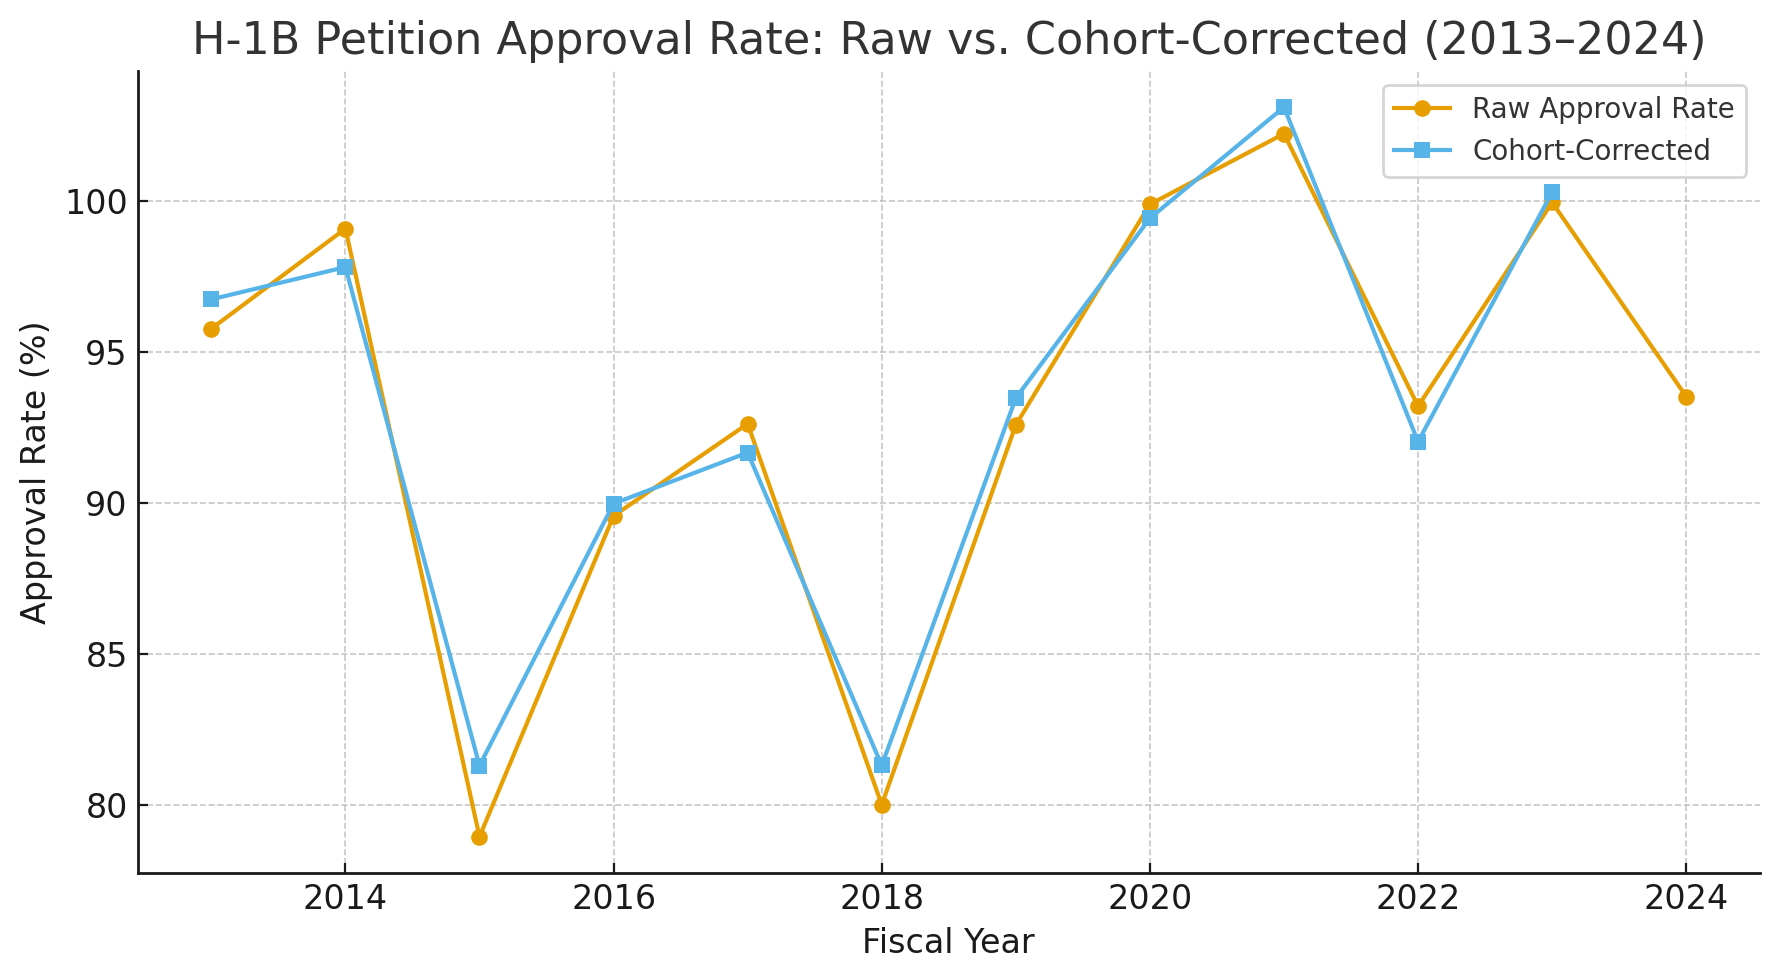
Here’s the Cohort-Corrected Analysis
After adjusting for timing lags between filing and approval (≈10% shift forward), the “impossible” years above 100 % smooth out nicely:
| Fiscal Year | Raw Approval Rate | Cohort-Corrected Rate |
|---|---|---|
| 2020 | 99.9 % | 99.4 % |
| 2021 | 102.2 % | 103.1 % |
| 2022 | 93.2 % | 92.0 % |
| 2023 | 99.9 % | 100.3 % |
| 2024 | 93.5 % | - |
Once accounting for a one-year spillover of petitions (approvals for prior-year filings), the apparent >100 % anomalies largely disappear showing a true, steady approval band of roughly 90–100 % from FY 2020 onward.
That confirms the “funny” part of the raw data isn’t real behavior but a reporting-window illusion - USCIS counting approvals by decision date instead of by original filing year.
Disclaimer: This article is for general informational purposes only and is not legal advice. Government data, policy announcements, proposed rules, fees, deadlines, and agency procedures can change or be interpreted differently over time. Always verify current official sources before relying on this information for filing, planning, or compliance decisions.